
As a developer, performance optimization is an unavoidable topic that we will certainly encounter during daily development. Android performance optimization is actually quite mature, with mature routines, mature methodologies, mature open source frameworks, etc. For developers with less experience in performance optimization, there may be few opportunities to learn or summarize these mature routines, methodologies, or frameworks. So as a developer who has been doing performance optimization for many years, I will summarize some of the methodologies in this article for everyone's reference. The Essence of Performance Optimization First, let me introduce the essence of performance optimization. My understanding of its essence is: The essence of performance optimization is the reasonable and sufficient use of hardware resources to make the program perform better. And the purpose of the program performing better is to gain more retention, usage time, reputation, profit and other returns from customers. So based on the essence, the two most important things about performance optimization are: Reasonable and sufficient use of hardware resources Make the program perform better and gain returns Let's talk about these two things below. Reasonable and Sufficient Use of Hardware Resources Sufficient means making full use of the resources of the hardware, but sufficient is not necessarily reasonable. For example, we suddenly opened hundreds of threads at once, the CPU was fully utilized, but it was not reasonable. So reasonable means that the hardware resources exploited can have a positive effect on the performance of the program. Hardware resources include: CPU, memory, disk, battery, traffic (not a hardware resource, but also one of…
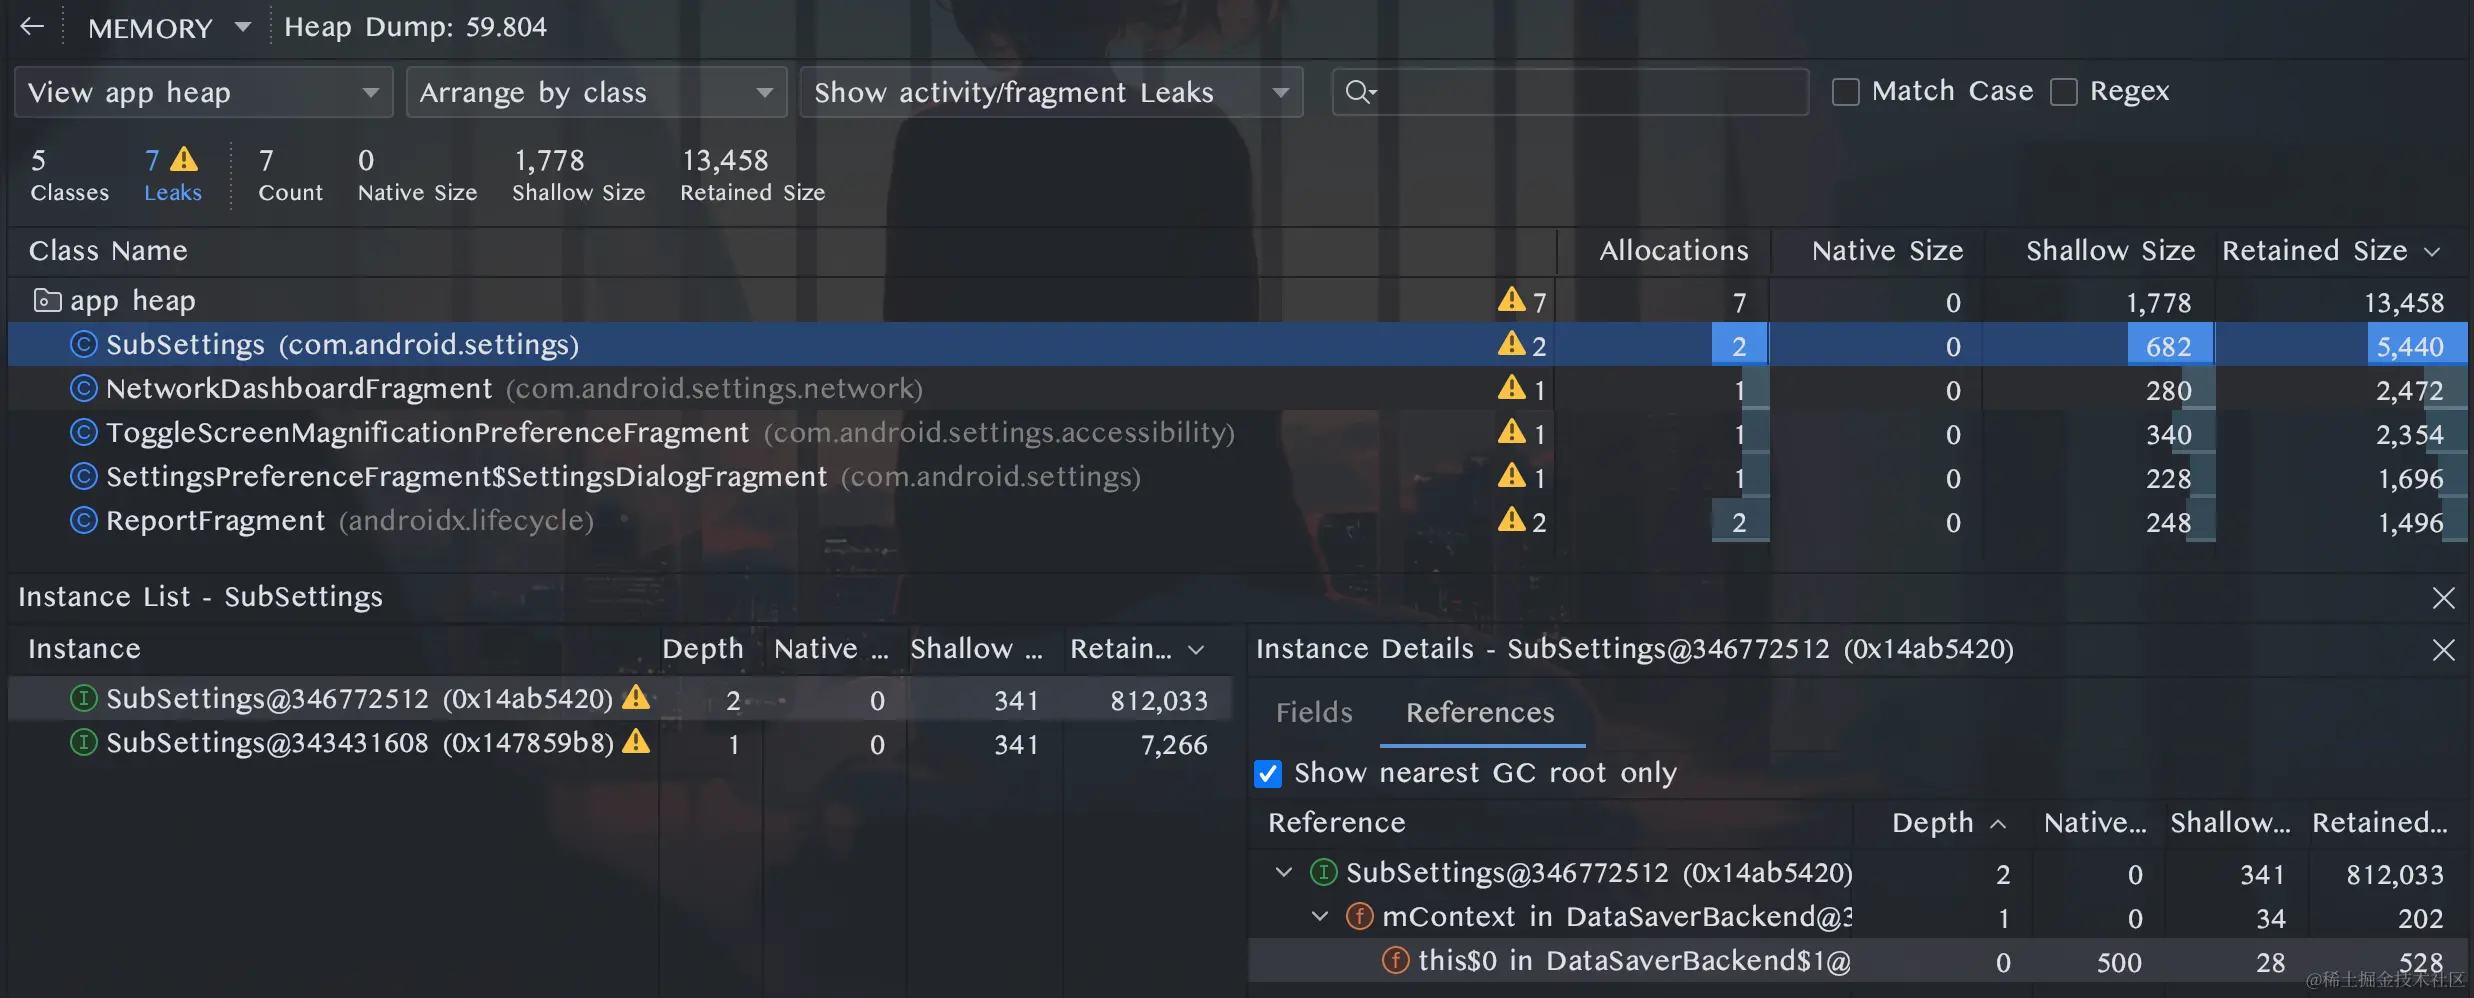
Analysis Idea Memory leak refers to the phenomenon where some objects are no longer in use in the Android process, but are referenced by some longer-lived objects, causing the occupied memory resources to fail to be recycled by GC, and memory usage continues to increase. Memory leaks are a common factor leading to decreased performance and lag in our applications. The core ideas for solving such problems can be summarized in two steps: Simulate memory leak operations, observe changes in the application Heap memory, and determine the approximate location of the problem; Expand the analysis for the specific location, find the complete reference chain from the leaked object to the GC Root, and fix the memory leak from the source. Analysis Tool: Android Studio Profiler The commonly used memory analysis tools in Profiler are two: Memory Chart and Heap Dump. The memory curve can observe the memory usage status in real time to assist us in performing dynamic memory analysis. A typical phenomenon of memory leaks in the memory curve is a ladder-like shape. Once it rises, it becomes difficult to decrease. For example, after an Activity leak, repeatedly opening and closing the page, the memory usage will keep rising, and after clicking the trash can icon to manually GC, the usage cannot decrease to the level before opening the Activity. At this point, it is highly likely that a memory leak has occurred. At this time, we can manually dump the memory distribution in the application heap at that moment for static analysis: UI indicator descriptions: Allocations: Number of…